oc create -f https://raw.githubusercontent.com/radanalyticsio/equoid-openshift/master/fabric8-image-streams.json
oc create -f https://radanalytics.io/resources.yaml
oc create -f https://raw.githubusercontent.com/infinispan/infinispan-openshift-templates/master/templates/infinispan-ephemeral.json
Scalable trending item detection on streaming data
Introduction
Equoid is a microservice-driven application which implements a heavy hitter assessment system for data streams. As will be discussed, Equoid uses Count-Min Sketch objects as the foundation for its top-k computation. Furthermore, Equoid leverages Apache Spark for scalable processing of streaming data.
Using the instructions that follow, you will be able to deploy Equoid on an OpenShift cluster with a simulated stream of a dataset provided in the Equoid repository. In addition, guidance is provided for using Equoid with the dataset or stream of your choosing.
Implementation
Reducing transfer and storage quantity
When thinking about keeping track of the top-k items received in a stream, it is tempting to pursue a counting approach wherein every element received has its count kept. This, while guaranteed to be correct, can be prohibitive with respect to data transfers and storage footprint. Consider a system where the streamed items to be counted have a massive or countably infinite range of values. In this case, storage must be allocated for a label and counter, each item of the stream will require a lookup and increment, and a check to see if a shuffle is needed, assuming the data is to be sorted in-place.
Equoid, on the other hand, incorporates a Count-Min Sketch for keeping track of the heavy hitters received over the stream. Without delving into the math involved, a Count-Min Sketch is a probabilistic data structure which provides a frequency table of events, in the top-k case these events would be a given item appearing on the stream. In terms of storage and computation it amounts to a set of hash functions mapping events to frequencies, so a table of hash functions is maintained. As mentioned, the counting approach is guaranteed to be correct since it takes into account every item ever seen on the stream. In the Count-Min Sketch case, it is known that a measure of overcounting is possible and expected, however, for large scale data streams, the impact of this overcounting is usually neglible. Furthermore, parameters have been exposed in Equoid for tuning the sketches to the data stream as described further below; by tuning these parameters to your data stream you can optimize the performance of the model, though this is not discussed here. Another benefit of using the Count-Min sketch approach is the disregard of anomalous or spurious values. However, this also eliminates the potential for detecting similar but different values (e.g. itemN vs itemn.) This could be addressed by considering similarity measures of incoming values with those currently in the top-k.
Data Sources
In data streaming applications, an issue that arises is the availability of quality data streams. Indeed, seldom are organizations willing to part with their live streams gratis. One can consider a synthetic stream, wherein a dataset is transmitted piecemeal over a stream, in a temporal fashion if desired, or at random. However, this is still limited to available datasets which may not possess the characteristics one wishes to address in their solution. As such, this notion of a synthetic dataset could be extended such that controls are provided for adding randomness to the record selection and/or generation process. For illustrative purposes, Equoid has three sample use cases, all derived from the same dataset. Namely, the online retail dataset made available through the UC Irvine Machine learning library found here. We address the cases where a dataset is to be passed linearly through the stream, the case where one column is chosen at random using a Zipfian distribution and sent through the stream, and a case where two columns are chosen at random and sent through the stream. For convenience, we give a file for each of these which can be streamed to the data publisher.
Architecture
Equoid is made up of a number of components which provide a means for determining the top-k elements in a stream during a specified temporal window. This is made possible through a hosted web UI and backend REST interface for parameter updates.
The services of Equoid are:
-
A data publisher
-
A message broker
-
A data handler
-
A caching layer
-
A web UI
-
A REST API for adding items to the set of possibilities the data publisher chooses from
The following diagram shows the overall architecture of Equoid.
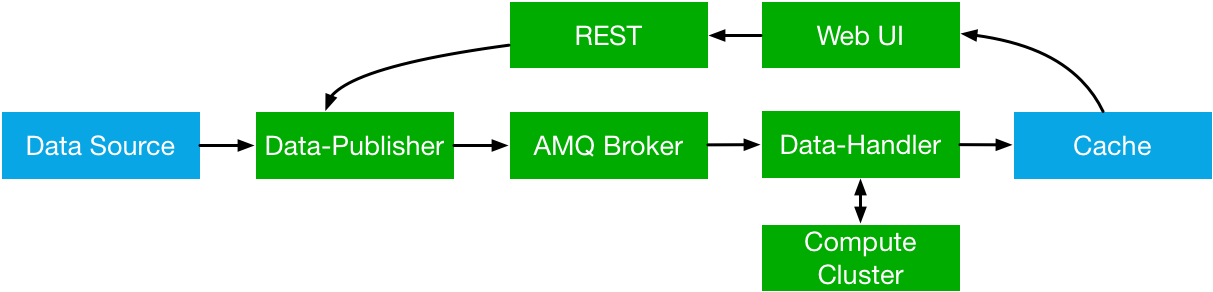
Equoid utilizes a caching layer for storing the top-k values. The data publisher transmits records to Artemis, the data handler retrieves mesages from the Artemis broker, parses or converts them per user specification, then adds the information to the extant top-k object. It’s worth noting that multiple instances of the data publisher and data handler can co-exist, which would be akin to a production system.
Software Components
We chose to use Artemis for the message broker, with the expectation it would be scalable in terms of number of streams as well as volume of traffic. In the same vein, we utilized Spark for our microservice requiring scalability, namely the data handler. Since we wished to take advantage of extant Spark libraries, and Spark’s CMSketch object is only (as of this writing) available in Java and Scala, we chose to implement the handler in Scala. In the interest of uniformity, the sample data publisher is also written in Scala. Furthermore, the AMQP Spark connector used by the data handler was developed by Paolo Patierno at Red Hat, with more information this tutorial and associated upstream project.

Installation
Equoid consists of a number of microservices which require deployment to an OpenShift instance. In order to get you started as swiftly as possible, in this section a walkthrough of installing and configuring the Equoid services is given.
Prerequisites
-
An available OpenShift instance.
-
A terminal with the OpenShift (
oc) command and active login session are available. -
An OpenShift project you own.
Procedure
-
Install Image Streams and Templates
Depending on your OpenShift instance, some of the image streams necessary for Equoid may not be available. To be certain you have what’s necessary to build Equoid, run the following sequence of commands:
These provide the Fabric8 fuse-java image stream for the data-publisher service, the radanalytics.io Oshinko resources for facilitating Spark cluster creation and deployment as well as S2I for the data-handler, and the Infinispan template for the caching microservice, respectively.
-
Launch Artemis
We’ll get Artemis up and running, as it is necessary for both the publisher and handler:
oc create -f https://raw.githubusercontent.com/radanalyticsio/equoid-openshift/master/artemis-rc.yaml
-
Launch Infinispan Cache
We’ll want our caching layer in place before we begin streaming and ingesting. The following will get an Infinispan pod running.
APPLICATION_USER,APPLICATION_PASSWORD,MANAGEMENT_USERandMANAGEMENT_PASSWORDshould be changed to your desired values. For purposes of this example we’ll useradleefor all our credentials.oc new-app --template=infinispan-ephemeral \ -l app=datagrid \ -p APPLICATION_NAME=datagrid \ -p NAMESPACE=`oc project -q` \ -p APPLICATION_USER=radlee \ -p APPLICATION_PASSWORD=radlee \ -p MANAGEMENT_USER=radlee \ -p MANAGEMENT_PASSWORD=radlee -
Launch Data Publisher
We can next begin publishing our streaming data by starting an instance of the data publisher.
OP_MODEdescribed later should be set to the mode you wish. Also,DATA_URL_PRIMARYshould be set to the location of your data set or data potential values file. For purposes of this example we’ll use linear processing of a full dataset contained in theequoid-data-publishergithub repo.oc new-app \ -l app=publisher \ -e OP_MODE=linear \ -e DATA_URL_PRIMARY=https://raw.githubusercontent.com/radanalyticsio/equoid-data-publisher/master/data/StockCodesLinear.txt \ --image-stream=`oc project -q`/fuse-java \ https://github.com/radanalyticsio/equoid-data-publisher -
Launch Data Handler
We are now ready to start our data handler. Note that
INFINISPAN_HOSTandINFINISPAN_PORTneed to be set to appropriate values, in the case of the template provided, these aredatagrid-hotrodand11222respectively. In addition,WINDOW_SECONDSis the number of seconds for which you wish to track the top-k items,SLIDE_SECONDSrepresents the number of seconds to slide your data window each iteration, andBATCH_SECONDSis the size of samples you wish to acquire from the message stream at a time. Finally,OP_MODEneeds to be set to the same value as set for the data publisher. In our example we will use "linear: corresponding with our previous setting for the data publisher, and 20 seconds for the window, slide, and batch sizes.oc new-app --template=oshinko-scala-spark-build-dc \ -l app=handler \ -p SBT_ARGS=assembly \ -p APPLICATION_NAME=equoid-data-handler \ -p GIT_URI=https://github.com/radanalyticsio/equoid-data-handler \ -p APP_MAIN_CLASS=io.radanalytics.equoid.DataHandler \ -e INFINISPAN_HOST=datagrid-hotrod \ -e INFINISPAN_PORT=11222 \ -e WINDOW_SECONDS=20 \ -e SLIDE_SECONDS=20 \ -e BATCH_SECONDS=20 \ -e OP_MODE=linear \ -p SPARK_OPTIONS='--driver-java-options=-Dvertx.cacheDirBase=/tmp'Note: the data publisher and data handler can take several minutes to build from source. If in doubt of the build progress, from the command line you can run
oc logs -f bc/equoid-data-publisherandoc logs -f bc/equoid-data-handleror look in the two components respective sections of the OpenShift UI (e.g. browse to project overview, click equoid-data-publisher or handler application arrow to expand and display build status) -
Launch Web UI and Set Up Keycloak
Equoid’s web UI is launched using a script developed by one of Equoid’s contributors, Jiri Kremser. The following calls will utilize that script to set up the UI as well as a Keycloak instance for users to login. Finally, an edit role is given to the project’s service account so additional data handler instances can be created/modified.
BASE_URL="https://raw.githubusercontent.com/radanalyticsio/equoid-ui/master/ocp/"
curl -sSL $BASE_URL/ocp-apply.sh | \
    BASE_URL="$BASE_URL" \
    KC_REALM_PATH="web-ui/keycloak/realm-config" \
    bash -s stable
oc policy add-role-to-user edit system:serviceaccount:`oc project -q`:default
Equoid Application Settings
Equoid’s system configuration and tuning parameters are described below.
Data Publisher
DATA_URL_PRIMARY - URL of either full dataset or list of all field values for the linear and single OP_MODE settings, respectively.
DATA_URL_SECONDARY - URL of all field values for the dual OP_MODE setting.
OP_MODE - Operating mode: single for a list of field values from which random elements will be generated, dual for two lists of field values from which random elements will be generated, linear for a dataset meant to be read in sequence and transmitted.
Data Handler
WINDOW_SECONDS - Size, in seconds of window for which the top-k elements should be determined.
SLIDE_SECONDS - Size, in seconds, of the amount to slide the sample window by each iteration.
BATCH_SECONDS - Size, in seconds, of the batch size to be acquired from the broker.
OP_MODE - As with the data publisher, single for a list of field values from which random elements will be generated, dual for two lists of field values from which random elements will be generated, linear for a dataset meant to be read in sequence and transmitted.
Settings for Examples
- Single-field sales messages generated from a set of possible values for item ID as provided by UCI dataset
-
-
DATA_URL_PRIMARYhttps://raw.githubusercontent.com/radanalyticsio/equoid-data-publisher/master/data/StockCodes.txt for data publisher -
OP_MODEsingle for both data publisher and handler
-
- Dual-field sales messages generated from a set of possible values for item ID and country as provided by UCI dataset
-
-
DATA_URL_PRIMARYhttps://raw.githubusercontent.com/radanalyticsio/equoid-data-publisher/master/data/StockCodes.txt for data publisher -
DATA_URL_SECONDARYhttps://raw.githubusercontent.com/radanalyticsio/equoid-data-publisher/master/data/Countries.txt for data publisher -
OP_MODEdual for both data publisher and handler
-
- Single-field sales messages sent in order as provided in the UCI dataset
-
-
DATA_URL_PRIMARYhttps://raw.githubusercontent.com/radanalyticsio/equoid-data-publisher/master/data/StockCodesLinear.txt for data publisher -
OP_MODElinear for both data publisher and handler
-
Usage
Web Interface
With all the microservices running, you can now view a visualization of the data stream’s top-ks for the parameters you have chosen. By browsing to the OpenShift web UI for your cluster, logging in, and looking at your project’s overview, you should see a pod/application named equoid-ui with an associated URI. You could also run oc get routes from the command line to get the URI. By browsing to the address, you will then be at the initial splash screen for your equoid system, as shown in the following:
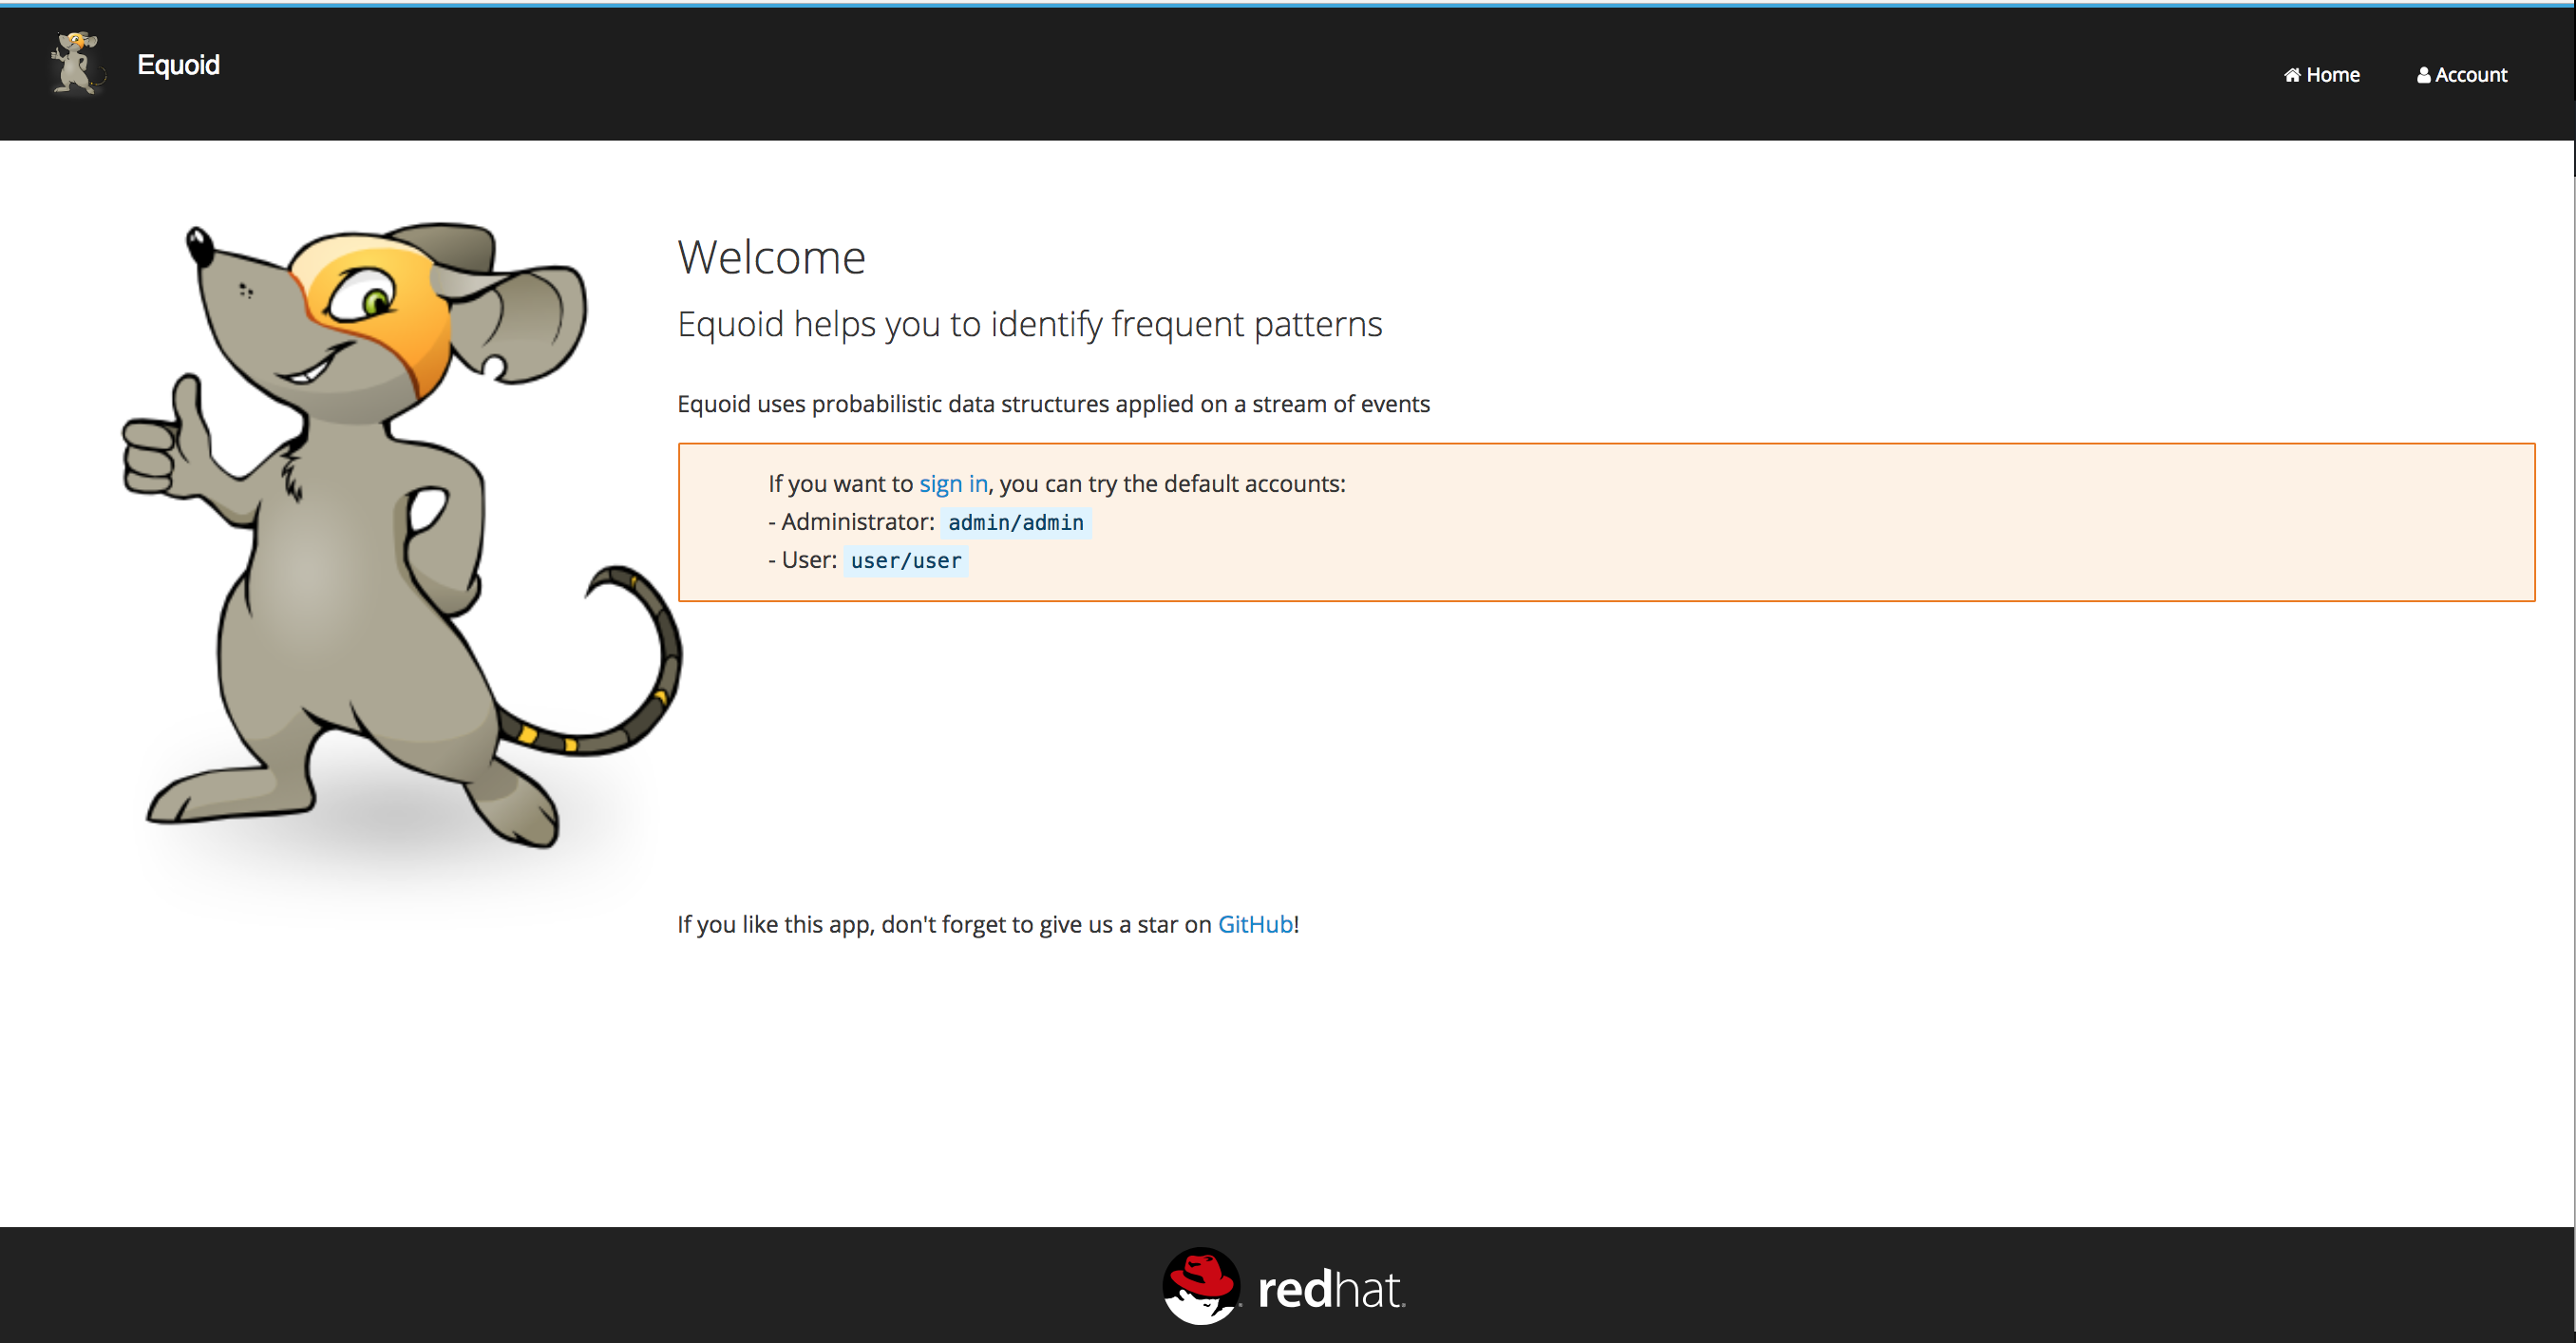
By clicking on "sign in" you will be taken to the login screen. You can log in using either of the default credential sets listed on the login page, then click on the graph tab. You should see a visualization of your stream’s data which updates periodically. Similar to the following figure, which shows an example of Equoid determining the top-3 items for 20 second windows. By hovering over areas of the graph, a breakdown of the items within received within the time window are displayed, as shown in the figure.
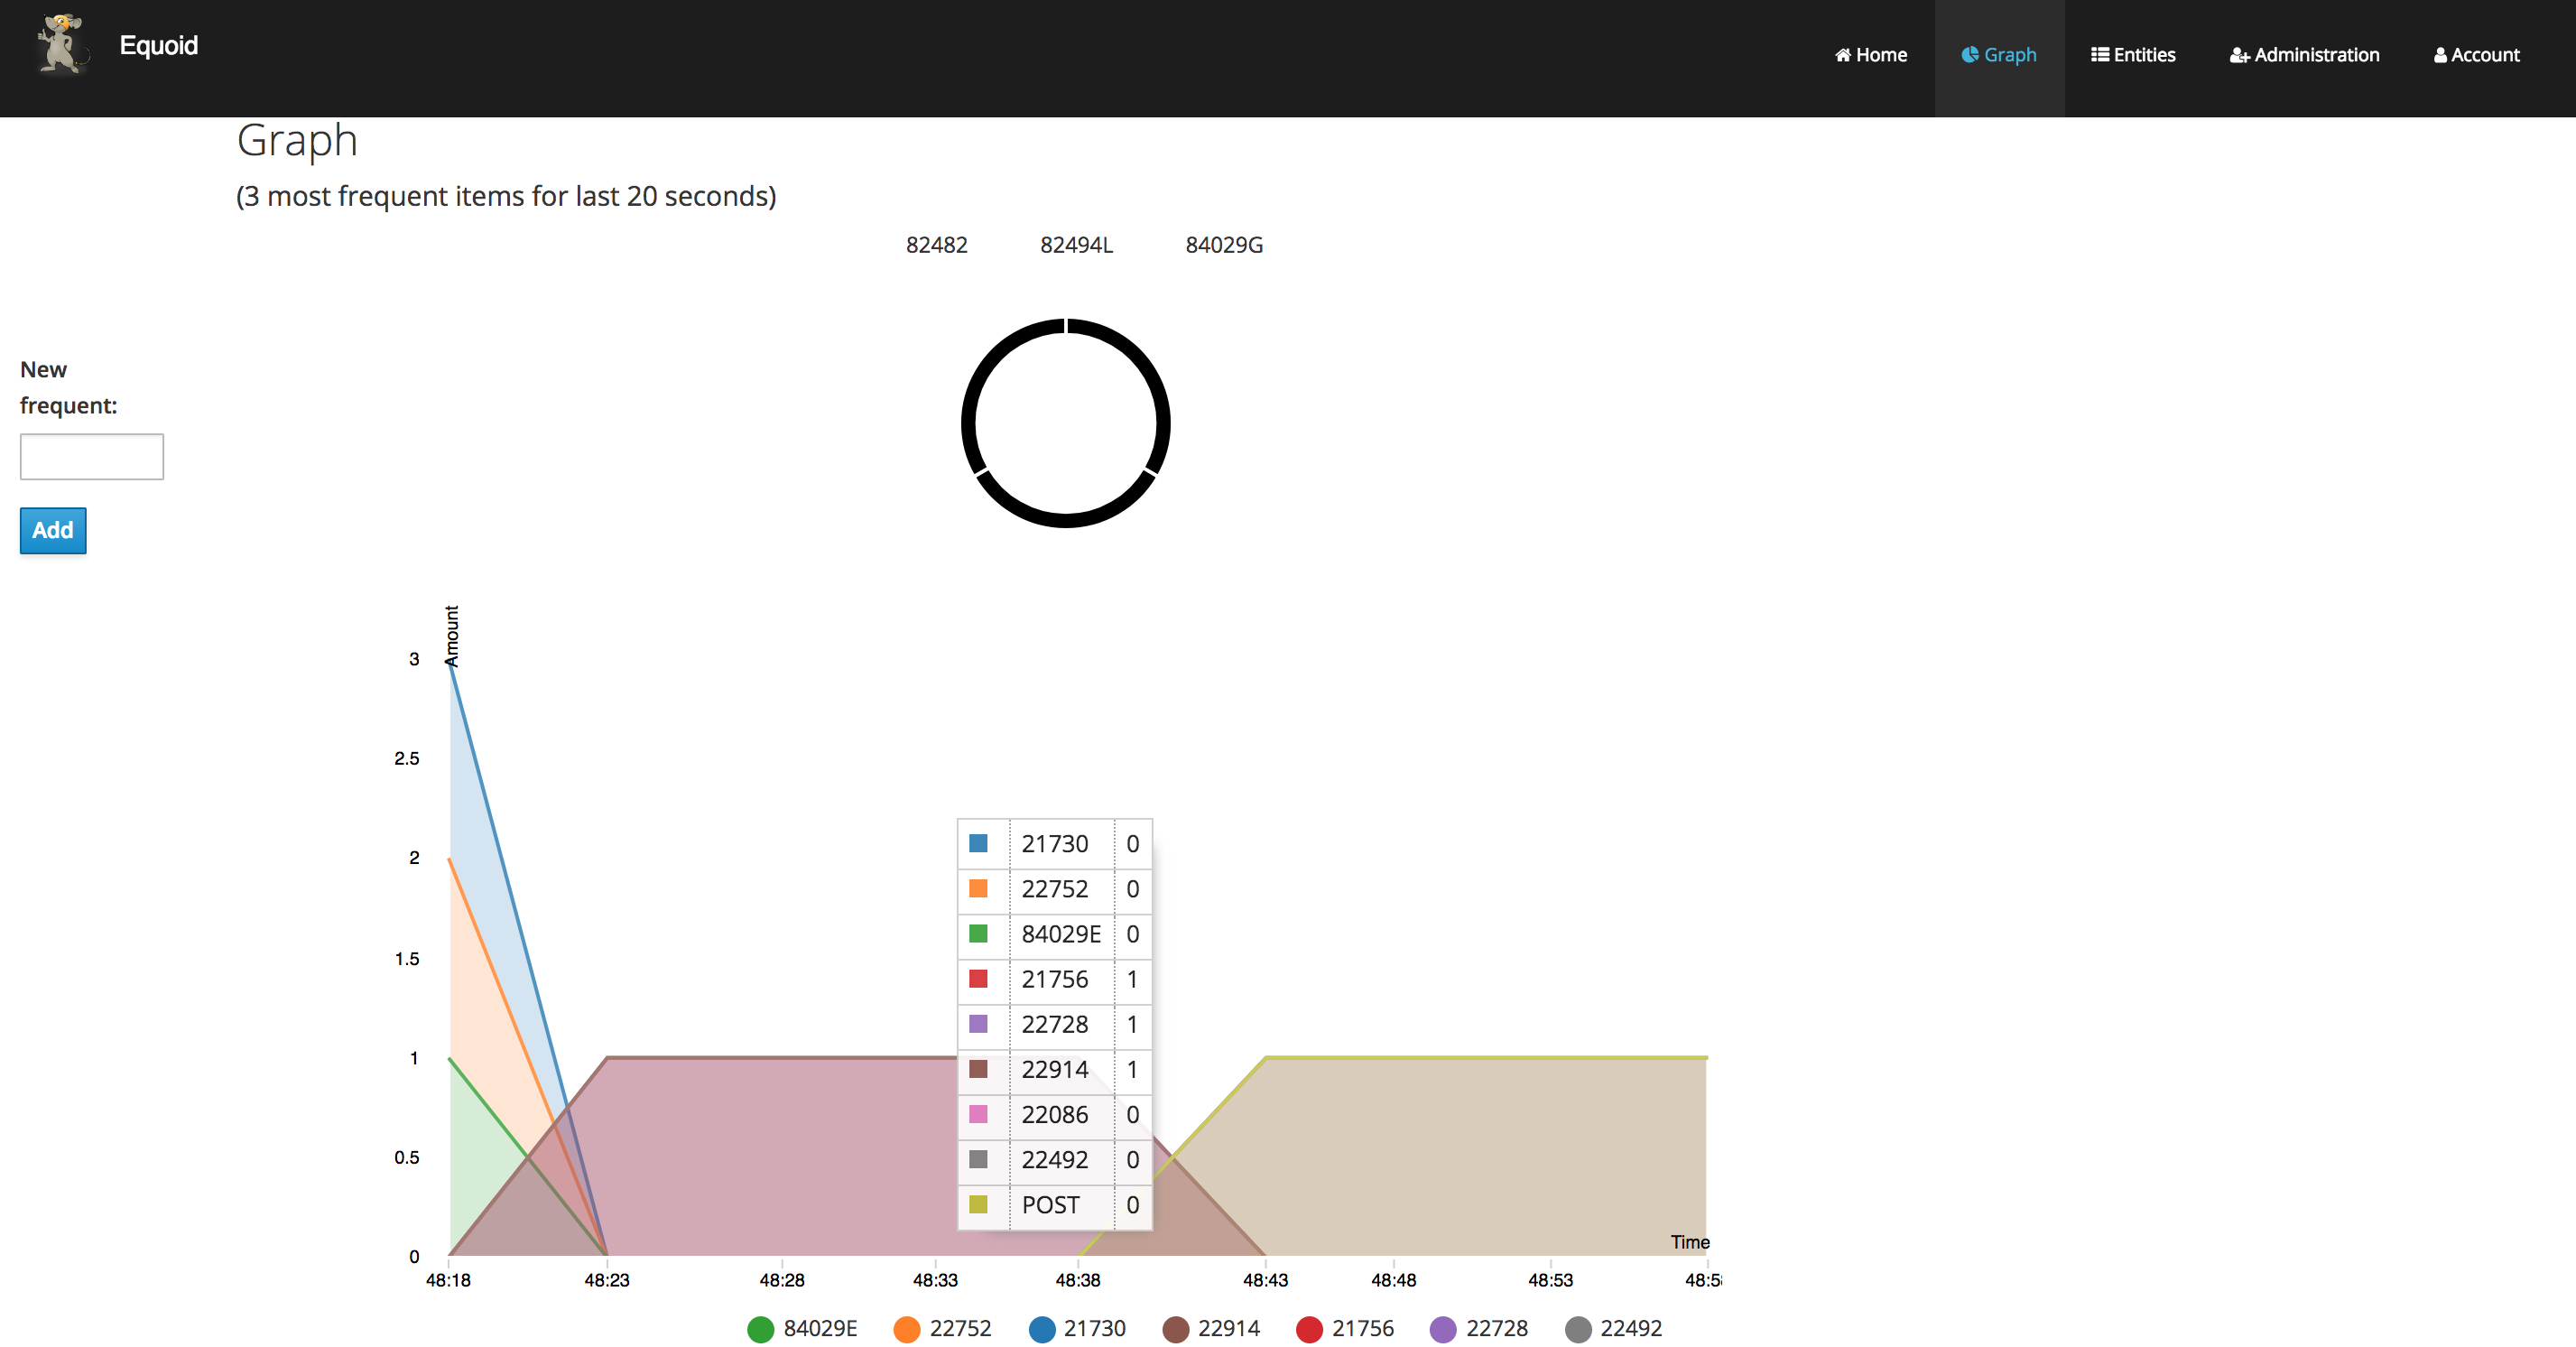
In addition, you can add a new frequent item by entering an item ID in the textbox on the left of the page and then clicking on the add button. Finally, you can add another data handler via the oc command, and a bash script is included in the equoid-openshift Github repo to facilitate additional data handler instances. Once these are up and running, the web UI will automatically add their data in a separate graph tab.
Expansion
Multi-field specification and selection
One potentially useful feature would be to provide a means for specifying a priori the format of messages such that individual fields or combinations of fields could be considered for top-k analysis.
Another would be to expand on parameter tuning, some further analysis of the incoming data stream to guide parameter settings, for example.
Videos
No videos are available for this application.